Occupancy is an incredibly important contact centre metric. Dead time, when agents aren’t making, previewing, or wrapping calls, can get incredibly expensive. Minimising it can be one of the most effective methods of reducing costs in an inbound call centre.
In this article, we’ll discuss how exactly to calculate call centre occupancy, and how you can use it to improve efficiency.
How to calculate call centre occupancy
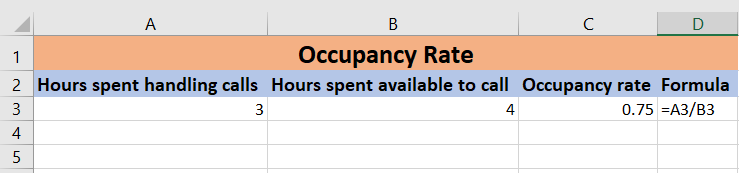
Call centre occupancy can be calculated with:

So, you’re essentially calculating how much time agents spend actually performing productive activities as opposed to being marked as available.
In Excel, you can simply grab your two numbers an put them in a cell. Then make a formula to divide them in another cell.
It’s important to note that while it is technically possible to calculate this KPI on a per-user basis, it’s more commonly-used as a more holistic measure to assess the load your team is under (we’ll explain why below).
Importantly, you must have accurate data to be able to calculate an occupancy rate that actually reflects agent utilisation. Think very carefully about the numbers you’re using – does your time in-call include previewing and/or wrapping?
Also find out if your total time available includes break/pause time. Ideally, it shouldn’t – you’re calculating the load your contact centre is under, not how motivated your agents are. There are plenty of other KPIs for this purpose.
What occupancy means

The purpose of calculating your occupancy rate is to measure how “occupied” your agents are – the extent to which they are being worked.
In most situations, you want an occupancy rate over 75% but under 85%. Too low, and agents will be sitting around twiddling their thumbs for too much time in between calls. Too high, and agents may feel overworked – leading to burnout, mistakes on-call, and potentially a loss of motivation.
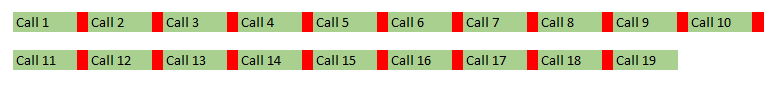
Think about the delay between calls your occupancy rate will result in. Let’s assume that a contact centre has an occupancy rate of 95%, agents work (meaning, they are logged in) for 480 minutes per day, and their average handle time is 24 minutes.
Agents will in effect make 19 24-minute calls per day, with 24 minutes of time available but not receiving calls. 24/(19-1) = 1.33 minutes of time in between each call, which is quite reasonable.
But if we halve the average handling time (AHT) to 12 minutes so that agents make 38 calls per day, this delay more than halves to 24/(38-1) = 0.65 minutes (39 seconds) in between calls.
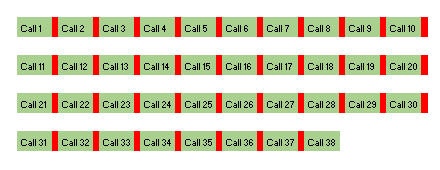
So, think about your AHT, and what an acceptable delay in between calls would be for your team.
It’s important to note that occupancy is mostly used on inbound initiatives. When you’re dialling outbound, as long as leads are available, agents should be spending nearly all of their time previewing/talking/wrapping. You can use break or pause time on outbound campaigns to get a better understanding of how productive agents actually are.
Optimising your occupancy rate

Obviously, the basic way of increasing or decreasing your occupancy is to alter the number of staff you’re rostering. But you don’t want to pay for agents who aren’t going to deliver a good return on investment, nor do you want to leave yourself stranded during peak periods.
Here are some smarter ways to optimise your rostering:
- Look at complementary metrics, like your arrival rate, to develop smarter staffing schedules based on your expected call volumes.
- Use staff management software to keep on top of your rostering.
- If you need extra flexibility, consider hiring virtual agents, especially those who are willing to work on a part-time basis.
- Instead of switching around your scheduling haphazardly, make better-use of your reps’ time during quiet periods by engaging them on outbound initiatives (following up with customers for example) or completing training programs.
Complementary call centre metrics

As we just mentioned, you can use your arrival rate to figure out the times of day, and days of the week, when the highest volumes of calls are coming in. You can also look at your organisation-wide pause and break time to assess how effectively agents are using their time.
Other KPIs you can use to assess contact centre load include service level. This looks at how quickly calls are picked up, and can help you figure out if you had too many or too few staff rostered in a specific period.
For example, a service level of 70/30 means that 70% of calls were picked up within 30 seconds. This is considered the industry benchmark, but you might have different needs depending on your vertical and the customers you service.
You can also look at the longest hold time a caller experienced on a specific day or in a specific week. If a single customer had to hold for ten minutes, this is most likely going to be an outlier, but you need to make sure that these sorts of issues aren’t happening repeatedly. Ask yourself if it’s acceptable for someone to be stuck on hold for 10x your target time, and if so, define how often it is acceptable for this to happen.
Conclusion
Ultimately, occupancy is useful as a broad-level overview of how well-worked agents are on average, particularly on inbound initiatives.
However, like any KPI, it cannot be used in isolation. It’s important to look at other metrics to develop a more holistic picture of how your reps are performing, and to develop more efficient rostering.
Also think about the ultimate effect of your occupancy level – the delay agents face in between calls. Consider your AHT, and what this means for your occupancy rate. In general, the longer your AHT, the higher you can make your occupancy rate while still ensuring a comfortable delay in between inbound calls.