Measuring thousands of metrics is all well and good. But what’s the best way to use them to analyse your call centre performance?
In this guide, we’ll show you the 27 best contact centre metrics, and how to use these industry standard KPIs to improve agent productivity on your initiatives.
Industry Standard Call Centre Metrics

You’ve probably heard of many of these metrics before.
But here we’ll let you in on a little industry secret: how you can use these KPIs to improve agent and contact centre performance.
1. Customer satisfaction
It’s pretty clear why this is important: if customers aren’t satisfied with your support, they’re much more likely to switch to a competitor.
Unfortunately, it can be a little difficult to measure precisely. You can use:
- After-call surveys
- Voice analytics
- First-call resolution rates (more on this below)
- Customer loyalty – do those who have more calls logged tend to stay with you for more or less time?
How to use it
Poor customer satisfaction can have a number of causes. Agents might not be understanding their inquiries, may not have the power to solve their problem, or may be unwilling to make the effort to come up with an effective solution.
In response to declining caller satisfaction, have a look at your agent KPIs. Are they bright and enthusiastic about turning up to work, or do they often arrive late?
If that’s not the problem, have another look at the information they have in front of them. Are your scripts up to scratch? Could you use a more intuitive CRM integration in order to better-display customer information?
Finally, use your QA module to analyse specific call segments – like those that resulted in a positive outcome, and those that didn’t. How are your agents responding to the challenges your leads/customers present them? What’s creating pauses in the conversation – is your agent flat-footed, or are they unable to access the information they need in a timely manner?
2. Call emotion

Why not give your agents the opportunity to tell you how their calls are actually going?
Metrics like call emotion (which we measure here at contactSPACE) allow agents to rate each call as either poor, fair, or good. It acts as a broad, macro-level metric which gives you a nice and simple overview of how your day/week/initiative’s calls are going.
How to use it
You can use this metric to find outliers – exceptionally good or bad calls. Give the call recordings a listen, and find out what made that conversation different. Then, you can either reinforce what the agent did well, or fix what could be improved.
Alternatively, this metric can be used to better assess the quality of your data (for outbound calls). Just make sure your agents are actually taking the time to rate every call!
3. First-call resolution (inbound)
One thing we need to emphasise right off the bat: over-relying on talk-time/calls-per-hour metrics can be dangerous.
If your agents are under to pump to resolve calls or close deals as quickly as possible, this won’t give them the time to genuinely engage with the contact and ensure that their needs are completely satisfied.
Instead, measure first-call resolution. For inbound calls, you’ll save more time by fixing the customer’s issue the first time, rather than forcing them to call back 3-4 times.
If a first-call resolution isn’t possible, give them a call back from the same agent, preferably on the same day. This not only offers a better customer experience, but also reduces expenses – only one agent has to spend the time coming to understand the customer’s problem.
How to use it
If clients are always having to contact you multiple times, instruct your agents to focus on solving their problem. Consider experimenting with showing different metrics on their home dashboard and see how this impacts call outcomes.
If this still doesn’t help, consider refining your agents’ workflows. Think about whether they have the resources and training necessary to help the customer with their problem in a timely manner. CallGuides® might be able to help with this issue.
4. Pause/break time

Instead of measuring calls per hour or average call times, consider looking into each agent’s pause/break time per hour, also known as their adherence to schedule.
This KPI measures how long the agent isn’t managing contacts – meaning they’re not available for calls, not wrapping, and not previewing a new call.
How to use it
Pause/break time is the ultimate productivity measure that won’t interfere with important conversations.
Try to keep your agents under your target numbers of minutes of break time per hour. To define this target, think about your needs as an organisation and as a contact centre.
For example, if you need people making calls at certain times of the day, look to lower pause time when you want your agents available for calls or dialling contacts.
5. Wrap time & preview time
For those who love to dive into the nitty-gritty of each and every call, wrap time and preview time are excellent metrics to measure.
- Wrap time measures how long agents spend “wrapping up” after each call they make. For example, adding call notes and changing CRM records.
- Preview time measures how long agents spend previewing (preparing for) the upcoming call they’re about to make. Generally, this time is used for the agent to prepare what they’re going to say, and reading over information you have on the specific lead.
Why are they so useful? For one, they can give an indication of how eager an agent is to dive into the next call. Remember though, lower isn’t necessarily better past a certain point – your agents need to have time to prepare for and wrap calls!
How to use it
With these sorts of metrics, you need to look for spikes – whether it be for a single agent or your entire team.
An uptick in wrap/preview time could indicate that agents are growing bored, in which case it could be worth introducing incentives to improve performance. Remember though – you need to consider how meaningful the data is – it could be that your team faced particularly complex calls that week.
6. Conversion funnel progression

Monitoring conversion funnel progression is awesome because it’s obviously incredibly outcome-focused. If you can get your agents focused on achieving your ideal call outcome (not necessarily just the final sale/resolution), you won’t have to worry too much about more granular stuff like calls per hour.
How to use it
Set up specific goals for specific outcomes you’d like to achieve. If you’re in telemarketing, you might simply want to make a sale on the first call. But for inside sales, you might like to be more specific about the stages in your buying funnel. For example:
- Lead requests a call-back/more info (this is your goal for the first call).
- Lead requests a demo.
- Lead makes a purchase and becomes a customer.
If you’re doing customer service, you might want to have something like:
- Customer provides details of their problem.
- Customer goes away to try and solve their problem – will be called back later.
- Customer’s problem is resolved.
Remember, you don’t want your agents pestering customers to stay on the line when they want to continue troubleshooting their problem later on. This is why a conversion funnel can be useful in some situations.
7. Service level (inbound)
Service level is a ratio measurement used to measure how quickly calls are picked up. It’s displayed in the format (% of calls picked up in X seconds)/(X seconds). So if you want to pick up 70% of calls within 30 seconds, your objective service level is 70/30.
How to use it
First, you must set an achievable goal for your service level. There’s no point trying to achieve 99/1, for many reasons. Firstly, the cost of employing so many agents wouldn’t be worth the improvement in response time. Secondly, even if you had 4000 staff, reaching such a perfect number is likely to prove rather impractical.
Service levels like 80/20 or 70/20 are more reasonable for most organisations. Remember to change your target level based on your initiative – some campaigns/calls are more important than others.
8. Customer effort (inbound)

Basically, this measures how hard it is for a customer to get connected to an agent. There’s a few ways to do this:
- Add their time in the IVR + time on hold.
- Just measure their time in the queue (if you don’t want to factor in your IVR).
- Get callers to complete a survey about how easy the support experience was.
How to use it
If you believe it takes too much effort for your customers to get connected, you’ve first got to find out what this actually means. Is it resulting in customers abandoning the call? Or are they already frustrated by the time they’re connected? If so, there’s a few things you can do:
- Streamline your IVR – don’t collect info you don’t need.
- Rework your IVR to have it ask only simple, easy to answer questions.
- Consider increasing how many agents you’ve got available during peak periods.
9. Abandonment (inbound)
As we just discussed, you don’t want customers hanging up before connecting with an agent – this is what abandonment measures. It’s basically another way of measuring customer effort.
How to use it
You don’t want calls to be classed as abandoned due to wrong numbers and accidental dials.
Therefore, use pre/post-threshold abandonment measurements. You can make the threshold a set number of seconds (normally 10-15 is good) after the call is connected to make sure it’s the real deal.
Look at your post-threshold abandons and see how long it typically takes for the caller to hang up. This allows you to find troublesome steps in your IVR which might be causing problems.
10. Contact load

By contact load, we mean the number of calls your agents make/receive on a specific day. This measures how much your contact centre is actually being used.
How to use it
With this metric, you can cut costs by forecasting exactly how many agents you need on each specific day of the week, for example. Ensure that you provision for higher than expected usage though – the last thing you want is to leave customers hanging!
11. Occupancy
A more quantitative method of measuring how well you’re scheduling your staff is measuring your occupancy rate. You’ll need to know 1. how long agents are spending on calls and 2. how long agents are available (but not on a call).
How to use it
Calculate your occupancy rate for a specific period with the following formula:
total time on-call/total available time
You’ll get a percentage figure, like 85%. This means that your agents spent 85% of their time in actual calls, and 15% of their time waiting to make/receive a call (previewing/wrapping counts as on-call).
The industry standard is this: anything lower than around 75% risks agent boredom, resulting in less-engaged calls. But if your occupancy is higher than 85%, you may be over-working your team, resulting in a larger number of silly mistakes when calling and higher turnover rates.
If your figure isn’t to your liking, adjust your staff schedules and check in on it again next month.
12. Contact quality

This is an overarching sort of KPI which measures how effective your agent’s conversation was with the customer. It looks at whether the user had their question answered, the professionalism of the agent, and whether their data was entered/captured correctly.
How to use it
Measuring the quality of an actual conversation can prove difficult. Here are some ways to track contact quality:
- Measure first-call resolution.
- Voice analytics.
- Have your quality assurance agent analyse call recordings and follow up with customers if appropriate.
Once you’ve got an idea of contact quality, you can rework your scripts and/or have another look at your agent training processes.
13. Cost per call
As the name implies, this is a method of measuring what it actually costs you to make a single call. This is an excellent method of keeping track of expenses, particularly for outbound operations.
How to use it
There are two ways to measure your cost per call:
The easy way
agent hourly wage/agent calls per hour
The hard way
annual operating costs/annual calls
Or you can use monthly figures if you like.
Once you have a baseline reading, you can compare performance day-on-day, month-on-month, year-on-year, or initiative-on-initiative to analyse how changes in contact centre strategy are improving the efficiency of your operations. For example, did switching to contactSPACE’s intuitive interfaces motivate your agents to make more calls? ??
14. Cost per minute of calling

Calculating plain cost-per-call can be deceptive. Under this model, five one-minute calls in which only part of the customer’s problem was solved are more valuable than a single five-minute call that completely resolved the client’s issue.
How to use it
As before:
The easy way
agent hourly wage/agent minutes in-call
The hard way
annual operating costs/annual minutes in-call
Again, you want to set benchmarks, change other strategies in your initiatives, and then measure these metrics again.
You can also get creative with this idea. We’re not going to list all the possibilities here, but you can also measure the cost per resolution of the client’s problem, cost per sale, and cost per live-chat session opened. Don’t get too caught up on cost though – consider the client’s needs as well as your expenses.
15. Revenue per call (outbound)
Now you know your cost per call/minute of calling, the next step (for an outbound operation) is to work out what each call is bringing in. To find this measure, simply divide revenue/number of calls made.
This KPI is essential in measuring the return on your investment in your contact centre – it’s the ultimate measure of performance.
How to use it
Get a baseline reading and compare the ROI of your calls from month to month. If it drops (or the number is too low in the first place), consider better-incentivising your agents to work towards your sales/operational targets. For example, introduce some call centre games.
If your revenue per call increases, this obviously means you’re doing something right. Think about what’s changed in the past period – have you got new agents or some awesome new software that could be helping you out?
As always, look for meaningful changes in the data relative to contact centre performance. If you sell candy cane over the phone, your revenue is obviously going to skyrocket in December!
16. Profit per call (outbound)

Bringing all these cost/revenue metrics together, you can calculate your profit per call with revenue per call – cost per call.
How to use it
Understanding this metric is useful in that it can help you identify, amongst other things, how well your outbound operations scale with volume. If your can keep your profit per call pretty steady (at a reasonable rate) while increasing your number of agents, it obviously makes more sense to get more leads and scale up the number of calls you’re making.
This is another KPI which is useful for measuring how your contact centre responds to strategic/tactical change. Does a new, more integrated office layout for example improve teamwork and hence the profitability of the calls you’re making?
17. Staff turnover
Agents constantly leaving your team is obviously an issue. If someone quits, you’ll need to find a person to replace them, and then of course you’ll have to train them and get them working effectively with your team.
How to use it
Rather than having a vague idea of your turnover, define it with:
Number of people to leave (in a particular period)/total number of employees
Having a certain amount of turnover isn’t necessarily a bad thing. It could indicate that you’re clearing out the dead wood, and (hopefully) replacing poor performers with more engaged employees.
However, high turnover (greater than 20-30% is the industry standard) could indicate a range of problems:
- Agents are over-worked, or bored (consider your occupancy rate).
- Your remuneration isn’t good enough (are your best people leaving? Where are they going? Conduct exit interviews).
- Inappropriate management methods. There’s a fine balance to achieve between supporting agents where they need it, and avoiding micromanagement.
18. Self-service accessibility (inbound)

This is another one of those ones that’s hard to define with a single number. It measures how easy and intuitive your self-service functionality (like your IVR, app or website) is to use. This is important because if self-service is unhelpful to your client, your agent will have to deal with their frustration.
How to use it
Some ideas to measure self-service accessibility:
- Customer surveys.
- Percentage of callers who abandoned in the IVR but did not call back.
- Percentage of callers who pressed 0 during the IVR to get an agent.
- Web/app analytics (using tools like Google Analytics): are users progressing through your online support process?
Depending on what you find, you may need to restructure your IVR or other self-support module to make it more accessible to users.
19. Sales/resolutions per agent
Measuring certain metrics on a per-agent basis has a number of benefits:
- It allows you to provide better-targeted advice.
- It allows you to incentivise and reward individual performance.
How to use it
Before reading too much into per-agent KPIs, you’ve got to ensure you’re looking at meaningful data. Is your sample space large enough? Were your agents given leads of a comparable quality?
Next, you can begin providing individualised advice to specific employees and rewarding those who do an awesome job.
20. Sales/resolutions per team

For many contact centres, you really want your agents to work well as a team. It can be worth tracking team-based KPIs in order to:
- Ensure your agents aren’t stepping on each other’s toes.
- Incentivise teamwork.
- Figure out which groups of employees work well together.
How to use it
First, define teams who work together on specific initiatives in your contact centre. Try to get certain groups working on certain groups of leads, for example, based on the skills that these agents possess.
Next, measure their performance in terms of goals like sales and the resolution of customer issues. Identify areas for team improvement, and work with your employees to improve performance. Finding out who works well with who could require a little experimentation.
Remember, you want to use team-based goals to prevent employees working too individualistically. Having twenty people working together without knowing what each other are doing can be quite unhelpful.
21. Arrival rate (inbound)
This is one of those metrics that’s best to look at on a graph. It involves segmenting inbound calls by time of day, or day of the week.
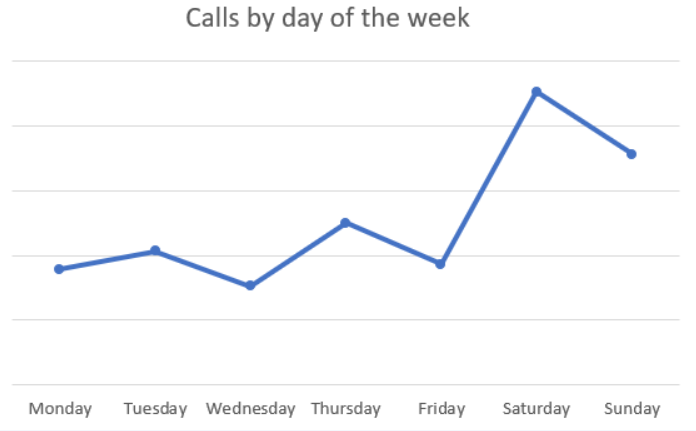
How to use it
You can use this metric to find out when people are using your contact centre. This is useful for:
- Scheduling staff efficiently.
- Upgrading your software/hardware capacity during peak periods of the year (super-easy with a cloud-based solution!).
- Contextualising other metrics. For example, if your service level drops, is this because you experienced an unexpected spike in contacts?
22. Longest call hold/wait time (inbound)
Ideally, you want no customer left behind in your contact centre. The longest call hold time metric measures (as the name implies) the longest period of time a customer waited to be connected to an agent on a specific day/week/month.
How to use it
You must first determine if you’re OK with a few outlier times. If you are, how many is too many, and how long is too long?
If the longest wait time is too long, you’ll then need to figure out what caused this issue and take steps to prevent it happening again. Do you have enough agents, or is your team spending too long wrapping/previewing/pausing when they could be talking?
23. Downtime
Having a contact centre that can’t make or receive calls is a bit like having a very large but very expensive brick.

Measuring downtime is critical because often you won’t notice your system going offline. If you’re down for just 30 seconds, what are the chances that any of the people that failed to reach you will let you know about the problem?
Remember, there’s a few ways of defining downtime. Do fire alarm evacuations or team training sessions count? If you’re trying to analyse how your technology is performing, you might want to exclude downtime caused by these sorts of factors.
How to use it
Watch out for abnormal downtime. If you begin going offline more often that you should be (ie, more than your software provider said you should be in the contract), then you should be calling them up and giving them an earful.
Also consider how meaningful the downtime is. If you operate from 9-5 and you go down for 5 seconds at 3AM, it’s probably not worth calling up your contact centre provider, unless it’s happening often and you’re worried it’ll begin occurring during business hours.
24. Customer issues
For customer service call centres, this is pretty straightforward. Have your agents log what customers are complaining about in well-defined categories. Then, analyse what the reoccurring problems are with your product and then work with IT/operations to resolve it.
However, you can also use this for outbound calls as well. Instead of identifying what the problems with your product are, get your agents to record what the most common hesitations are that customers have towards progressing in your conversion funnel.
How to use it
Obviously, you’ll need to work with your product team to actually resolve the issues customers are facing. The best way to reduce costs in customer service is to have the product need less ongoing maintenance from your support team.
For inside sales, it’s a little simpler. Draw up a mind-map of all the common issues customers have on a massive whiteboard. Then, collaborate on some potential ways your team can get around these objections. Try them out on a few calls and see what works.
25. In-call abandonment rate
Once you’ve beaten the gatekeeper (or your customer has beaten your IVR ?) you can look at what percentage of these people abandoned the call completely. Meaning, they said “no thanks”/”I give up” and put the phone down without giving your agent the chance to respond.
How to use it
If you get one of these calls, it’s worth listening to the recording to see what led up to the moment the customer gave up. From this, you can figure out what you can do to prevent this happening again in the future.
For example, could your team member have explained the solution they were offering in a more easy to understand manner? If you’re doing outbound, could you get more qualified leads or “hot data”? You might just conclude that the user was having a bad day – it happens!
26. Voice analytics

This is more of a method, rather than a specific KPI.
Voice analytics is the new industry standard in contact centre performance improvement. It looks at the words your agents and users are saying, and identifies trends to enable you to deliver better outcomes for customers and improve the effectiveness of your contact centre.
How to use it
The first way you can use voice analytics is to ensure that your agents are sticking to the script. You can look at what specific team members are saying, allowing you to deliver individualised guidance and training.
On a strategic level, voice analytics can allow you to build better customer service/sales/fundraising strategies. It can help you identify opportunities to upsell/cross-sell different products, and allow you to identify the best possible call-to-action for your pitch.
Plus, voice analytics can allow you to uncover the quickest and most effective methods of extracting the information from your client that you need to solve their problem.
27. The number of metrics you’re tracking
Metric-ception!
To keep track of organisational complexity, you need to understand a). what metrics you care about and b). why you care about them. There’s simply no point tracking stuff you won’t find useful or don’t care that much about.
How to use it
If you’re measuring more than 20-30 different KPIs, and you don’t have an in-house data analytics team, you might need to cut back a little.
Track 10-15 core metrics on your main dashboards and have 5-10 generally useful ones you can use on special occasions (like during employee performance reviews).
If you have a metric and you don’t find it all that useful (meaning, you never use it), don’t be afraid to chuck it out!
Conclusion
Got any other killer KPIs we haven’t mentioned? Drop us a comment – we’d love to hear how you’re using it in your contact centre!