As a contact centre manager, reporting is one of the most important things to get right. However, it’s also one of the most difficult.
In this guide, we’ve explained call centre reporting in detail. We’ve discussed the most important reports and how to use them, and how to use contact centre reports to improve your team’s performance.
After, we’ve also explained advanced analytics using tools such as Power BI, to help you get the most out of your contact centre data.
What is call centre reporting?

Call centre reporting is the process of monitoring and analysing your contact centre performance. It involves creating and viewing reports, and assessing performance by different data “dimensions” (structures for categorising the data). Typical dimensions used in the contact centre industry include agents or groups of agents, campaigns, locations, or products.
Typically, call centre reporting involves using the out-of-the-box reports included with your call centre software solution. However, it may also involve using external reporting tools, which sometimes offer the ability to perform more advanced analysis.
The purpose of call centre reporting is to generate insights that you (the call centre manager) can use to fix problems and improve performance. For example, you might notice that after changing your caller IDs for a specific outbound campaign, answer rates improve by 20%. You might then choose to invest in changing your caller IDs across all of your other campaigns, as a basic example.
You may also use call centre reporting to communicate the results your team is achieving to other stakeholders in the business. For example, during quarterly contact centre performance updates.
Analytics vs reporting

The word reporting is sometimes confused with the word analytics. The terms are often used interchangeably, although they actually have different meanings.
In short, reporting explains what is happening, while analytics explains why it is happening. Analytics is a step up from reporting, and is very important to get right.
Having access to analytics does not mean that you need to buy a super-powerful analytics software solution – it just means that you have the capability to turn your reports into actionable insights, by analysing the data shown in each report.
Call centre reports vs call centre dashboards
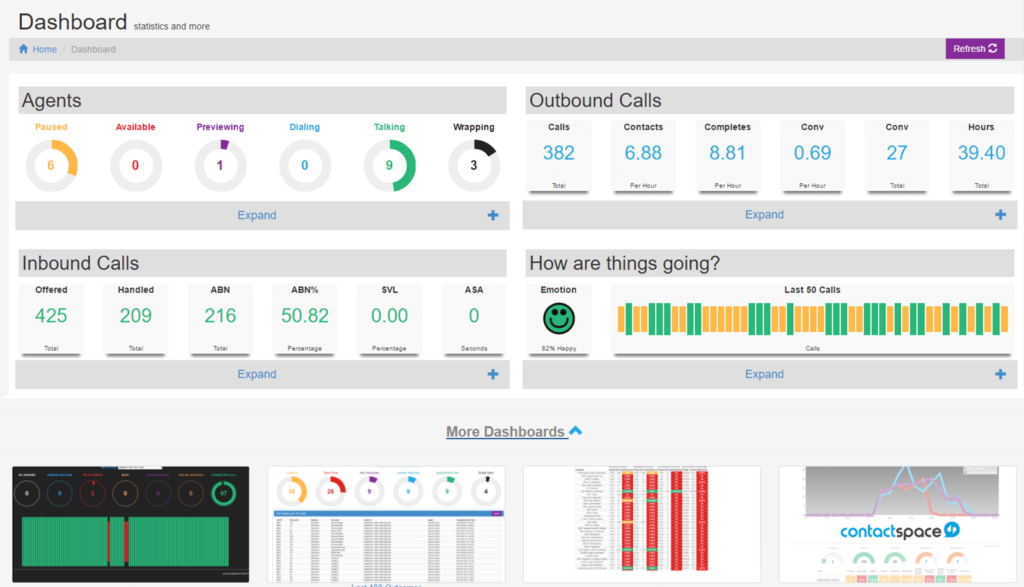
A contactSPACE call centre dashboard.
While call centre reports are used to develop deep insights into your team’s performance over time, dashboards help you monitor performance as it happens. For example, while a dashboard might show you which agents are on a call right now, your reports will show you how many calls each agent has made over the previous week.
Dashboards help you keep your finger on the pulse, and ensure that your contact centre is operating as it should be. On the other hand, reports let you take a more strategic view, allowing you to improve performance over the long term.
Read our full guide on call centre dashboards to learn more.
Best contact centre reports
Below is a selection of some of the most useful contact centre reports for most call centre managers.
Remember, different contact centres have different reporting needs. For example if you make a large volume of outbound calls, then outbound reports are going to be the most important to your team. Therefore, there may be certain reports that will be very important for you, that we haven’t mentioned on the list below.
1. Agent status and calling activity report
Your agents’ output ultimately drives your contact centre performance, which is why it’s important to keep on top of how they’re doing.
The agent status report will tell you:
- How much time the agent spent working
- How much time they spent on break
- How much time they spent paused/wrapping
The agent calling activity report will tell you:
- How many calls agents made
- How many contacts they made
- How many conversions/resolutions they achieved
With these reports, you can easily identify your top performing, most productive agents. You can also identify agents who may need help in certain areas in order to improve their performance.
From here, you can identify patterns in agent performance. For example, are new agents underperforming? If so, you may like to adjust your training programme, or pair new agents with an experienced staff member to help them learn the ropes more quickly.
2. Outbound dialler report

The outbound dialler report is your single source of truth for outbound calling performance. It will tell you:
- How many calls have been made, by initiative
- What results have been achieved on each initiative, such as contact rates
With this report, you can do a number of different things, such as:
- Ensuring your team is making enough calls each day, and not overdialling
- Monitoring data quality, as judged by your contact rates
- Measuring the effect of changes in your contact strategies, as measured by your contact rates
- Comparing initiative performance, to identify underperforming campaigns, or campaigns it would be better to focus on
Essentially, the outbound dialler report offers a holistic view of your outbound dialling performance. It’s the first place to look if you want to check in on how your different outbound initiatives are performing.
3. Outbound list penetration report
This report is very similar to the outbound dialler report we just looked at. However, it offers an extra level of granularity.
Rather than showing outbound performance by initiative, the list penetration report displays performance by each individual dataset or list that your team is calling.
This report helps you do things such as:
- Identify which datasets perform best, and invest more in acquiring similar data
- Understand why certain datasets are underperforming by looking at contact and conversion rates
- Identify timing issues – for example, certain datasets may have a high callback percentage, indicating that the data is good, but you’re reaching people at the wrong time of day
With the outbound list penetration report, you can dig deeper into outbound performance, especially in terms of how well you’re reaching people. This report is very helpful for optimising your calling strategies and tactics.
4. Inbound call reasons
Having a solid understanding of why customers make inbound calls can be extremely valuable from a wider business perspective.
For example, Pro:Direct Sport, one of Europe’s largest sporting goods retailers, use their contactSPACE call data to improve operational efficiency. As Jonathan Matthews, Pro:Direct Business Change Manager explains: “…with our ‘Where is My Order’ (WISMO) enquiries, we found that a carrier responsible for 8% of our deliveries was responsible for 40% of our WISMO enquiries. These types of insights are very valuable to our business.”
By looking into the exact reasons why inbound calls were coming in, the team were able to get to the root cause of the problem, helping to reduce the number of inbound enquiries occurring in the first place.
To analyse inbound call reasons, good preparation is crucial. You need to ensure that agents are able to easily log call outcomes as they occur, to verify that you’re collecting the right data about each inbound enquiry. If agents are logging the incorrect outcomes, or your call outcomes aren’t properly defined, then your reporting may provide less useful insights.
With contactSPACE, it’s easy to define call outcomes, which can be attached as buttons to each agent’s CallGuide workflow. As the call progresses, agents simply click the appropriate button, bringing up supportive material to help them answer the customer’s enquiry, and simultaneously logging call outcomes you can report on later.
5. Call volumes
Reporting on previous call volumes might not help you radically improve contact centre performance. However, it’s still an essential metric to look at for forecasting staffing requirements.
Using historical inbound call data, combined with some statistical methods to account for trends, you can predict how many calls you’ll receive over the next month or quarter. This will help you to work out how many staff you need each month, week, or day.
Forecasting is important for inbound and outbound call centres, however it’s generally a bit more difficult to get right for those mostly receiving inbound calls. This is because you never know exactly how many customers will call you on any given day. However, many outbound contact centres often use complex forecasting models, especially those that call inbound leads as they come in from a website or other external sources.
Read our complete call centre forecasting guide to learn how to do successful call centre forecasting.
How to generate better insights with call centre reports

It’s easy enough to look at your call centre reports and develop surface-level insights, at least once you get the hang of your reporting module.
However, it’s a lot more challenging to generate useful, actionable insights from your call centre reports on a consistent basis. The challenge is in using your reports analytically, to get to the bottom of why something is happening.
Here are some tips you can use to get the most out of your call centre reports.
- Take advantage of visualisation, rather than always looking at numbers on spreadsheets. For most people, it’s much easier to understand information when it’s presented visually.
- Take advantage of pivot tables when exporting reports. If you haven’t heard of them before, pivot tables make it much easier to analyse big datasets, especially when you have a large number of fields to work with. They also allow you to use sums, averages, and totals to help you get to the bottom of contact centre performance.
- Use scheduled reports to keep on top of useful metrics, and identify trends as they arise. If you find yourself viewing a certain report only on certain occasions due to time constraints, even though you know it contains useful information, it might be worth scheduling the report to appear in your inbox each week, using your reporting module.
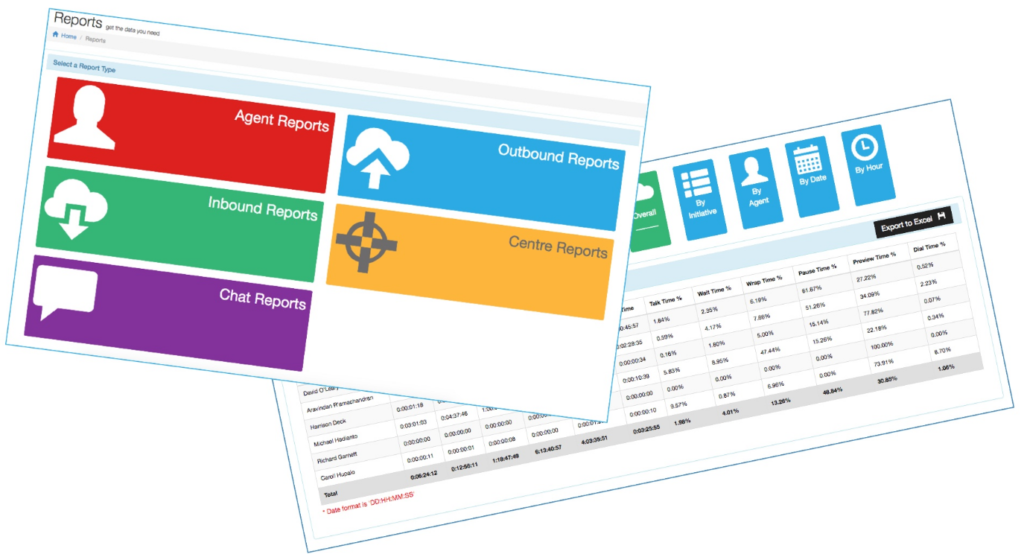
What makes a good reporting module?

Most cloud contact centre solutions will include reporting functionality. This reporting module will give you the ability to view information about your team’s historic performance.
However, not all reporting modules are made equal. Some are unintuitive, restrictive, or don’t allow you full control of your data.
A good reporting function:
- Allows you to “slice and dice” your data – meaning, giving you the ability to examine data across different dimensions, digging deeper into your data to gain more specific insights. For example, you may begin by viewing overall sales performance for the year, and then drill down into results by product/service category, or by a specific product/service that your business offers.
- Allows you to report on data in real time. Some reporting modules have a significant delay between when the data is generated and when you can begin to report on it.
- Allows you to view data and understand its implications easily. You want to be able to look at a given report and very quickly understand what the data means for your team. At a basic level, this means having reports with clear data headers, and easy to distinguish rows and columns. It also means having reports that utilise visualisation techniques (especially graphs) where appropriate.
- Allows you to schedule reports, ensuring you keep on top of important information. Rather than having to navigate to a specific report in your reporting module every day, a good reporting module will email you scheduled reports at regular intervals that you define. This can be a massive time-saver, especially if you have a number of reports you use on a regular basis.
- Provides a data-driven API, enabling you to perform more advanced data analytics. The last thing you want is for your data to be “trapped” inside a single reporting module – you need the flexibility to import data into your chosen business intelligence (BI) platform, in case you need to develop deeper insights, or create custom visualisations.
Advanced contact centre analytics

As we touched on above, sometimes it’s useful to perform a more advanced analysis of your contact centre performance.
There are a number of different reasons why you might like to develop more advanced insights, such as:
- Making a presentation to senior management, and wanting to showcase performance in certain areas
- Performing custom analysis or creating visualisations for your quarterly internal reports
- Creating a custom dashboard for a TV screen in your office, to show ongoing team performance
- Creating pivot tables
- Forecasting future staff needs, by taking historical call volumes and plugging them into a custom formula
There are a number of different BI software solutions on the market, such as Tableau and Power BI. You don’t need to know a programming language such as Python to use these tools, however coding knowledge can be helpful when performing highly advanced analytics, such as using large numbers of calculated fields.
For contact centre managers, what matters most is being able to easily and effectively connect your contact centre and business intelligence solutions. This is why contactSPACE includes a data-driven API, to help you instantly push data to your chosen analytics solution, and develop greater insights into how you can improve performance.